


In the following research, we want to analyze some observations related to the architectural and ideological component of BTC. Conclusions that we will make today do not claim to be the absolute truth, however, we can objectively assess many events from the point of view of the already established history and put forward a number of hypotheses. We will continue to consider the Bitcoin mining industry from the most objective point of view - a technical one. We will consider the same historical data as we did a year ago, as well as new introductory data, which, at the time of publishing the last study, we could not evaluate at all. We will partially repeat the information that we considered Halving of Bitcoin on 21.05.2021 and we will supplement them with several new circumstances that can radically change our view of the mining industry and its current state.
Research is on The Bitcoin Cycles. We will look at the ups and downs, consider their dependence on the BTC Halving events and the number of active wallets. To begin with, let's look at the information about all the BTC Halving events that have passed, adding new data to them.

Last time, we definitely noticed that every halving of Bitcoin is accompanied by an explosive growth of all possible metrics - from the price of the currency itself to the number of active wallets. We believe that this happens according to the following scenario, for convenience, we suggest importing some variables:
- Reward = X BTC
- Liquidity (BTC) = Y
- Liquidity (USD) = Z
- Demand for (BTC) = A
- Supply (BTC) = B
- Number of miners = G
- BTC Price = C
And so, for us, the situation looks like this:
Let's assume that at the moment the reward for the block = X BTC.
Cryptocurrency liquidity is a parameter by which it is possible to determine the impact of buy and sell transactions on the exchange value of an asset. Instruments with low liquidity tend to suffer from frequent price changes. And, conversely, the higher this indicator, the less volatility is characteristic of cryptocurrencies. Liquidity includes both the asset and the funds that participate in the trading of this asset (Y and Z)
Under the condition of constantly increasing demand ”2A→ 3A→ 30A→...”, increasing liquidity Z and maintaining a stable supply “B” (quantitative supply is exactly what halving and network difficulty affect, respectively, theoretically we have the most stable supply in the period between halving), as well as the growth in the number of miners “2G→ 3G→ 5G→...” ( and in this regard, an increase in network difficulty = a decrease in reward for the block ) we, according to elementary logic, observe an increase in the price of asset “C”.
However, if the demand has already reached the level of 30A, the number of miners, for example, reaches the level of 5G, continues to grow, and at this moment Halving event occurs - now the supply = B/ 2.
It is also important that Liquidity (Y•Z) largely consists of transactions that are not aimed at making a profit, in other words, liquidity is also used to support the exchange of assets for goods and vice versa (in our case, Bitcoin is also a payment tool).
Thus, we have regular transactions not aimed at any profitable investments + constantly growing liquidity + price growth + an increase in the number of miners + an increase in the block difficulty and the growth of all asset metrics. Then the so-called HYPE comes into play, which is also accompanied by an increase in price and also all metrics. Such a rapid growth of the asset, sooner or later exceeds some reasonable limits, since “emotions have already entered the chat.”
Naturally, a recession comes after the HYPE. Local price minima are updated, prices usually decline for a long time and stabilize around the price ranges of the last cycle. All speculators capitulate, miners turn off their machines, because the updated prices do not allow them to profitably extract currency. The market is cooling down. The network difficulty is gradually decreasing.
Now imagine that a sharp decline in BTC supply is imposed on the newly formed conditions, in the form of Halving - as you might guess, the market, hungry for high prices and tired of speculation, meets another shock - a shortage of liquidity. This literally means that the already familiar amount of Bitcoins needed to support non-speculative payments again becomes insufficient to process transactions + the reduced supply generated by miners, with the demand remaining, does not continue to keep the price within the old limits in order to ensure production - hence the natural price increase.
What happens next?
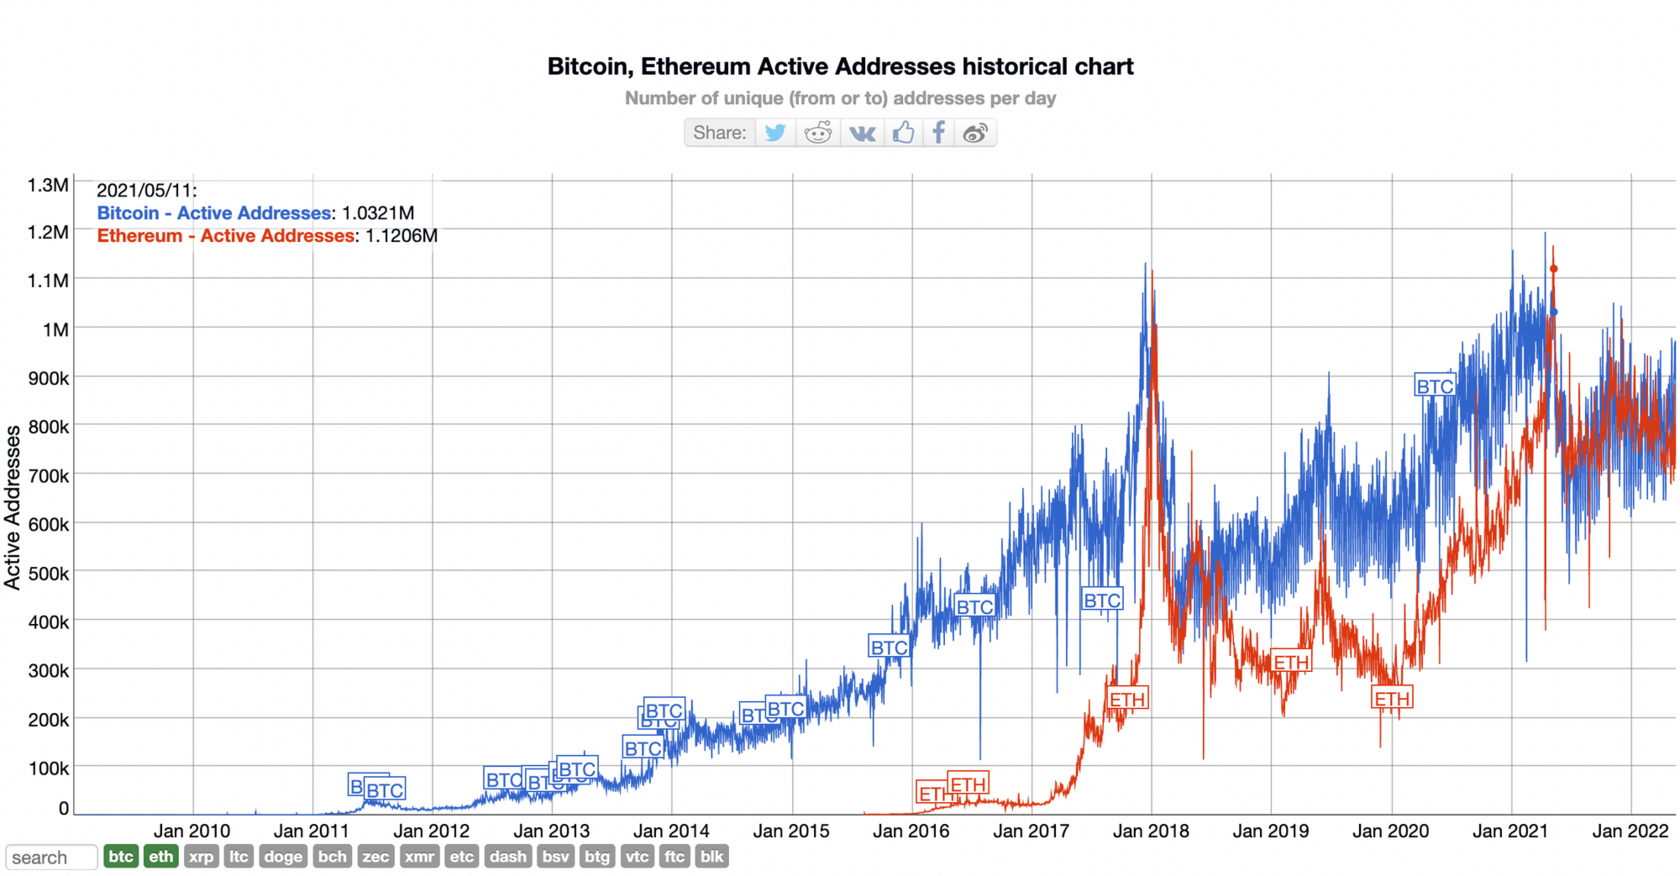
In the case of halving 2020, history repeated itself and Bitcoin was waiting for the strongest growth to $69K, which brought it to the $32,600K mark, exactly a year later. Note that the price has increased 3x from the price during halving 2020 and about 54x since halving 2016. The number of active wallets during and a year after halving (a new metric for our review) has also historically grown significantly, and halving 2020 was no exception.
However, in comparison with previous years, there is no multiple increase in the number of active wallets a year after the Halving event. This may be due to the fact that the last bullish rally of Bitcoin took place under the auspices of large investors, and the technological acceptance of the cryptocurrency. Hype around decentralized applications and NFT tokens could also significantly affect the number of active wallets on the Bitcoin network, because all these things unfold on independent blockchains, and if we pay attention to metrics, the number of active wallets on Ethereum network increased by a multiple over the same year: from 444.9K to 887K, which confirms our conclusions.
At the same time, the block difficulty, which has been steadily increasing since the zero block, as well as the hashrate of BTC itself, indicate an increase in the number of active mining equipment. If we keep in mind that organizations have become increasingly engaged in BTC mining (and even American companies over the past 2 years), we can conclude that despite the strongest collapse in prices, major players continue to strengthen their positions and this is already a very good sign of universal loyalty to the stability of Bitcoin Halving cycles.

Recall that the block difficulty = BTC value.
This is due to the fact that the main criterion of technical authority of BTC = the degree of its distribution.
Below we want to consider the technical picture of the current volatility of Bitcoin, and although it is not an easy task to draw unambiguous conclusions at the moment, we still cannot pass by the main technical characteristic of the coin — the activity of its traders.
For example, on March 10, 2022, one of the first public traders and on-chain analysts Willy Woo, who independently developed a lot of tools (https://woobull.com) to analyze the market, a person whose opinion and participation in the community we infinitely respect and support - stopped his column on market analysis for retail investors after 6 years market presence.
One of the reasons he pointed out that at the moment it is very difficult to analyze the crypto market and Price Action has become more chaotic.
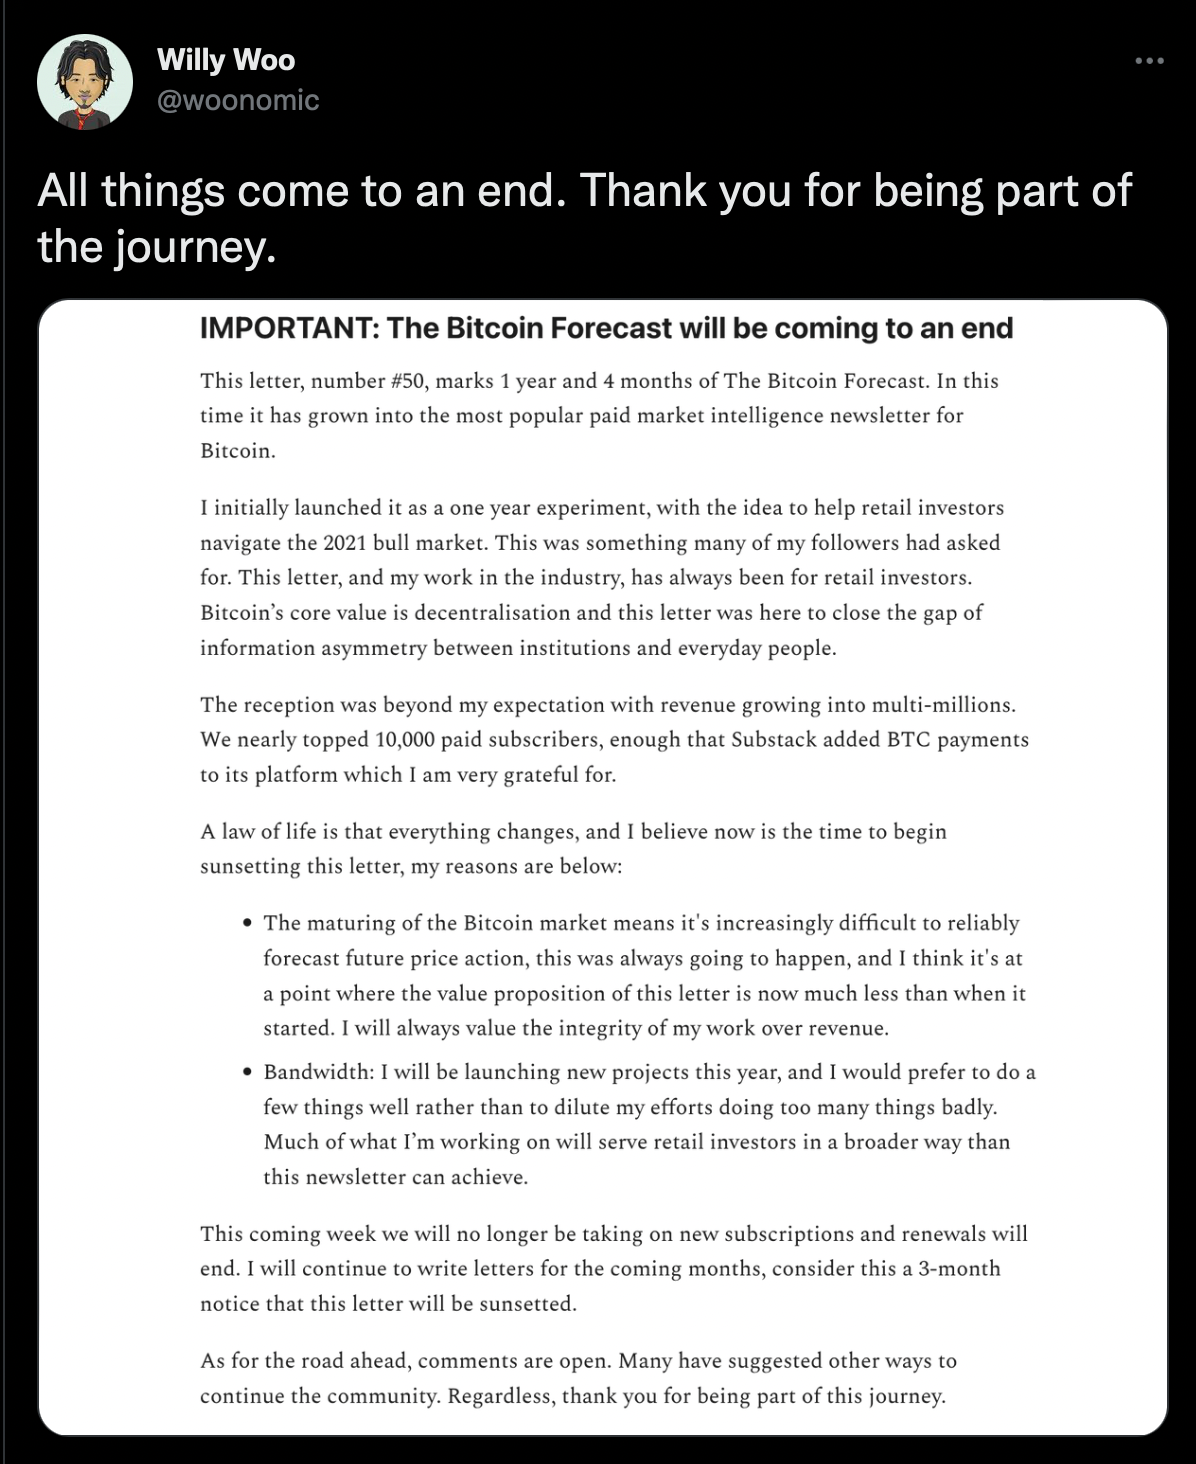
Well, we were happy to walk this path together with Mr. Woo, and thank him for a huge number of incredibly useful tools for a retail trader, which we will continue to use even in his absence.
Let's start with the long-term NVT signal indicator
As you can see, ** Bitcoin is still at the 200-day Moving Average and has also not touched the 200-week MA**. Taking into account recent fluctuations, the probability of coming to the psychological 200-week Moving Average remains very high. **The price range of the 200-week MA falls on the price level - $21-22,000**

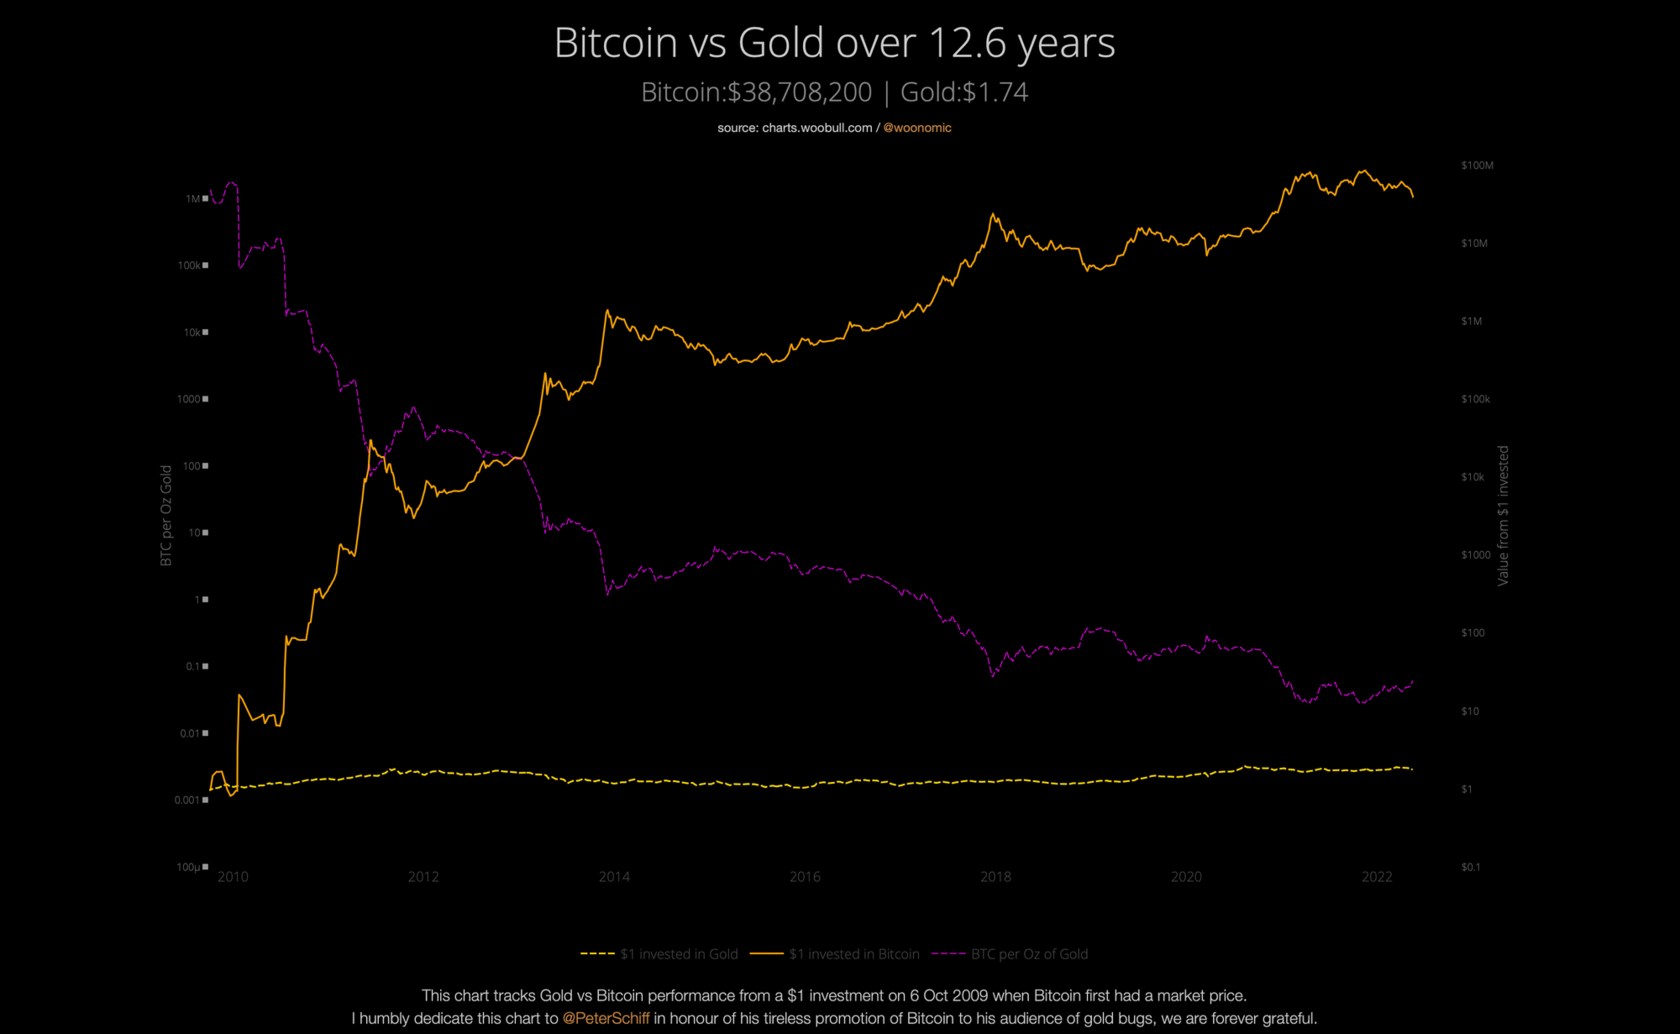
The following is proposed to consider the correlation graph of the Bitcoin exchange rate with the Gold exchange rate. The historical link between these assets first emerged in 2011, and significantly strengthened by 2013. On the chart below, you can see the inverse correlation between assets and at the moment Gold is steadily strengthening.
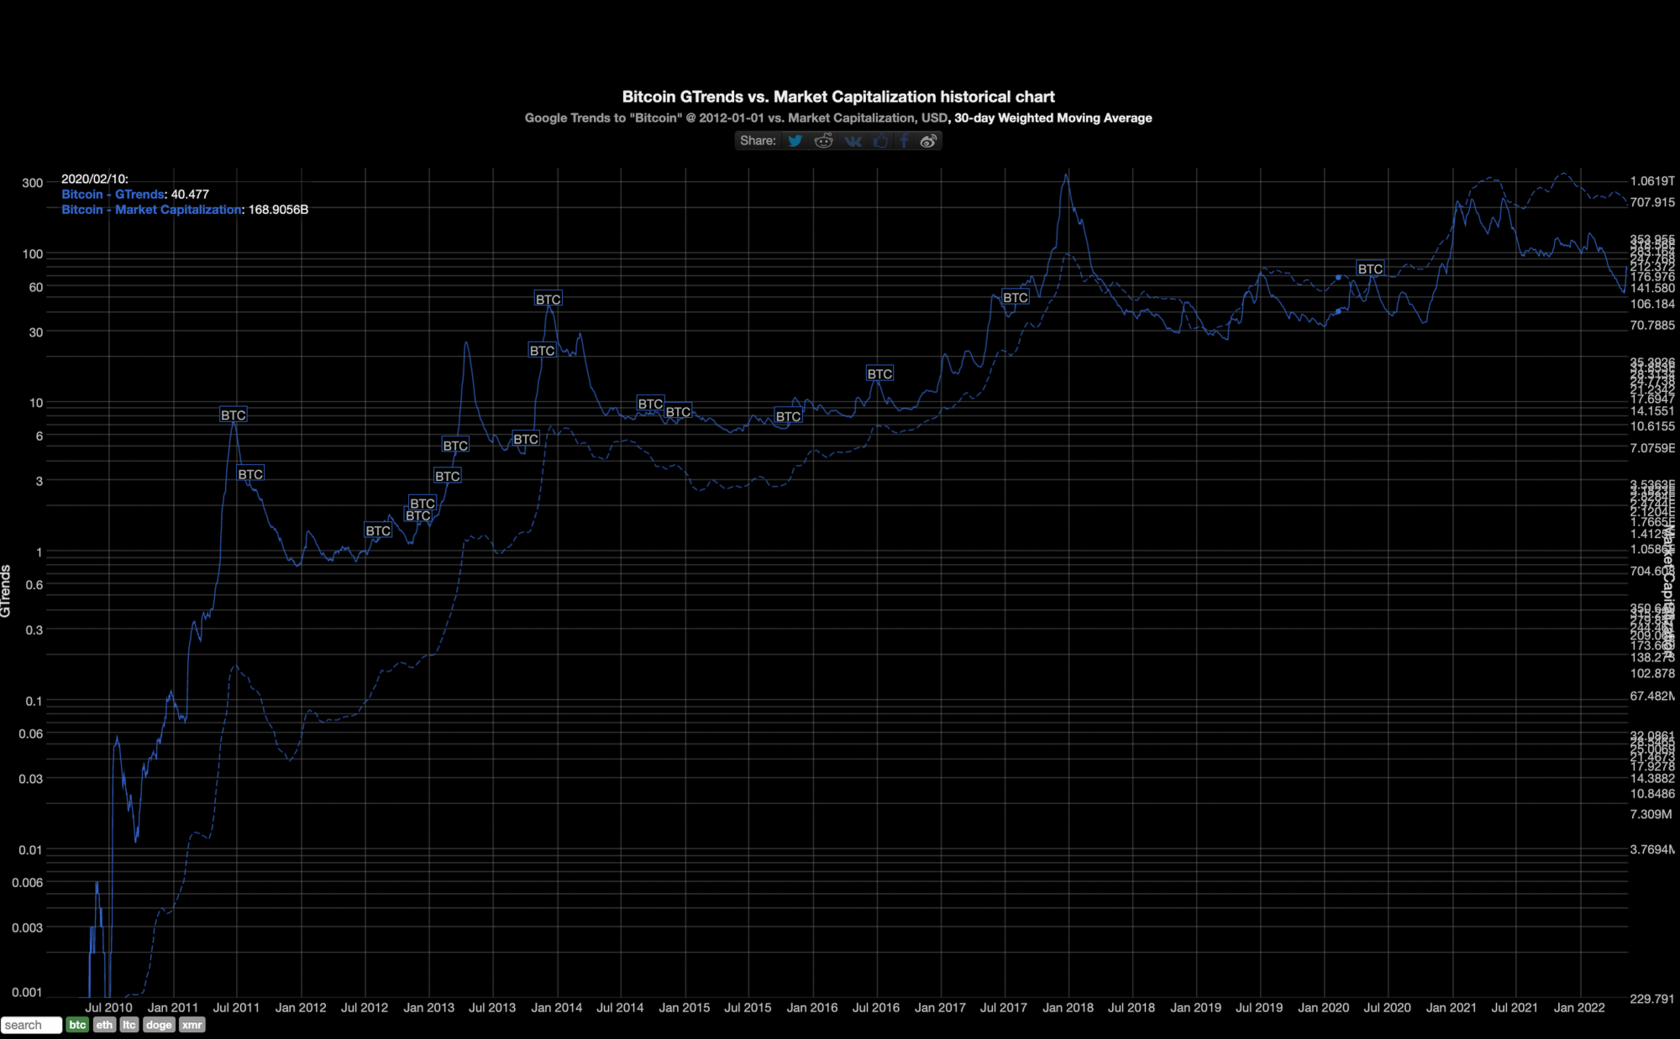
Last but not least, it is proposed to consider the historical chart of the popularity of cryptocurrency queries in Google Trends, provided by the resource bitinfocharts:
(https://bitinfocharts.com/comparison/google_trends-marketcap-btc-wma30.html#log&alltime)
This chart, in our opinion, can reflect the mood of the retailer-buyers even more accurately than the classic price chart, for several reasons:
- This chart may reflect the mood of the buyer
- This chart may reflect investments in the marketing part of the industry, “warming up” the audience for further rally
In both cases, we consider such data incredibly useful from the point of market analysis and highlight the historical confirmation of the correlation in the following details:
- GTrends warns the growth of Bitcoin ahead of several months, with the growing movements of its indicators
- At times of local market declines, the strong rise of GTrends warns of a possible intensification of the decline in the value of Bitcoin
- Trading patterns (double bottom, double top, etc.) are also worked out on the GTrends chart
To evaluate the correlation, it is also proposed to independently:
If we consider the current state of the above graph, we will see the following picture.
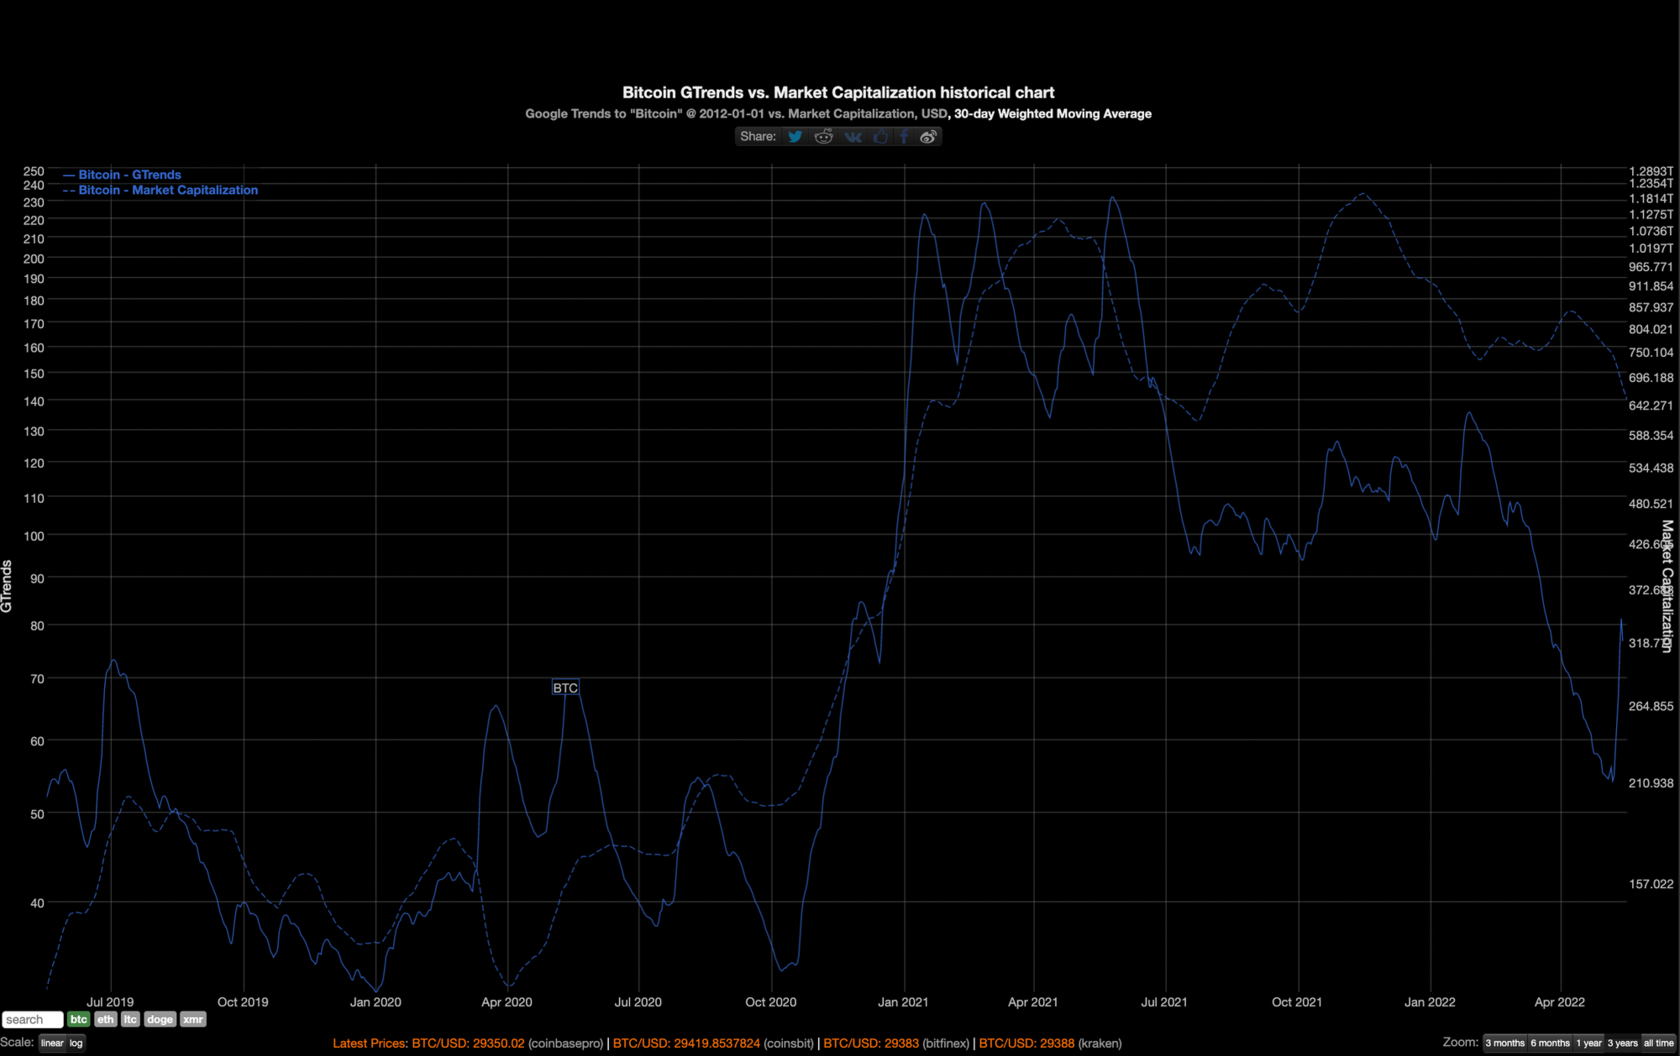
It can be interpreted in different ways. We tend to say that the decline will continue. At a distance of 3 years, Bitcoin has significantly succeeded in the popularity of requests, and the number has continued to decline over the past year, while practicing trading patterns.
At the moment, the collapse of the price of the First Cryptocurrency has led to a surge in GTrends requests, which can confirm the hypothesis that Bitcoin will continue to decline for some time before the Google Trend Chart shows us a steady rise in the number of requests.
CONCLUSION
At the moment, a little more than 2 years have passed since the last Halving of Bitcoin. This time pleased us all with incredible growth and profits. The medium-term earnings of miners remained at a very high level in this cycle, while the price of the first cryptocurrency increased by a multiple. Bitcoin mining has remained profitable and fair over the past 12 years, and the above data allows us to predict the continuation of the trend.
Today, the crypto market is experiencing some recession and correction, painful for speculators and neutral for long-term buyers. At such moments, the market clears, speculative trades fade into the background, and only long-term investors remain in the first place. Cryptocurrency flows “from weak hands to strong ones”, as it has been happening for many years, with one single goal - to become better distributed ledger.
Increasing loyalty to Halving cycles on the part of large international companies and the crypto community is one of the most reliable criteria for assessing the stability of the cryptocurrency mining market today. We believe that history will repeat itself, and the liquidity deficit created by Halving will again delight us with an explosive growth in popularity in the next cycle.


